My introductory finance class has got me interested in, well finances. Currently, we have a that project involves examining a couple's cashflow. This then inspired me to take a look at my spending habits. In order to do this, I decided to take a look back at my bank statement. This goes back to near the end of October, to the end of January.
This method is quite flawed because I completely do not remember what I did with any cash that I didn't get through my bank account. Nevertheless, lets call those amounts bonus money or whatever. It wasn't really a lot (I hope), and I guess some were really just withdrawals. Another note is that my clothing expenses are happily subsized by the government of mom and dad. Also, note that eating expenses are lessened because there are packed lunches meals that are made with groceries. Groceries is not a part of my spending.
This following chart looks at spending and how it was allocated. I tried to minimize the number of categories for easy viewing. Now, food covers all of fast food, restaurants, and snacks. Interestingly, I thought I would have spent quite a bit at places like KFC, but it was more of a high frequency transaction then it was a high expense. Electronics refers to DVD's, CD's, and video games. This is after getting a new MP3 player.
Withdrawals are that, although I think a large portion of that went to food. Thats the most likely scenario. Sports spending refers to equipment and sporting goods/wear. I don't know what some of them were exactly, but its likely to be things like an Oilers hat or winter gloves. The rest of the categories are self explanatory.
 So clearly, and its probably the same with most people, essentials like textbooks and bus pass take up the most. Its probably a good thing when these are the types of items that take up most of the spending.
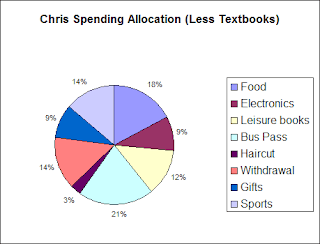
This next one is the same, but without the category textbooks included.
 I could have taken out bus pass, but I didn't think it was necessary. Now here, food shoots up as a high expense if you combine that with the likelihood that withdrawals mostly ended up as food. Food is probably still underrepresented because I can't account for a lot of other transactions.
 Some conclusions: It would be very beneficial to set up a food budget. Its about trying to eliminte those impulses, but acknowledge that you want to eat out and allow for a reasonable amount. I thought the "recreational" expenses such as reading, electronics, sporting are fairly low. They add up to 35% which I don't think is too bad. This is a spending chart, so there is no comparison to how much was put away and saved on here.
While looking at these, I imagined comparing these to the expenses of someone living on their own. Obviously this chart doesn't compare, it really has no monthly bills whatsoever to speak of. Basically, the spending is still that of a carefree student. It is a privilege to live the way I do, and I should start shouldering more of the load as well as taking advantage of the fact that the costs of life haven't caught up to me yet. It is something I already know, but looking at these really brought it to my attention...
1 comment:
My pie chart(monthly) would most likely say something like.. 50% automotive expenses. 13%electronics (mostly because I bought the wii last month). 2% movies. 35% food. I'm gonna go ahead and count my withdrals as straight to food. For all I know the 35% is shooting a little low. Which is bad. With these numbers in mind I can't wait till I ... switch insurance companies, and pay off my car. Then I'll have that 50% reduced to ... about 10-15% and spend my 35-40% on ...? food?
Post a Comment